Asset Limits in Public Assistance and Savings Behavior Among Low-Income Families
- Get link
- X
- Other Apps
Low-income families receiving public benefits in the United States are often subject to asset limits for eligibility, which some argue to be counterproductive to their long-term economic stability. Previous research suggests that families may be more likely to save when states increase these limits. Still, more research is needed to establish whether low-income families adjust financial decisions based upon TANF asset restrictions. Our study builds upon the Nam (2008) study, which analyzed the effects of “liberalizing asset limits'' on savings behavior. We utilized data from the Panel Study of Income Dynamics. The theoretical premise of this study is that when the asset limit is low, families are encouraged to avoid accumulating assets. Because building a savings account is a valuable first step toward self-sufficiency and eventual withdrawal from public assistance, a low asset limit appears to be a counterproductive public policy. Moreover, could potentially experience administrative savings as a result of caseworker’s spending less time verifying applicant assets. We sought to understand the following research questions:
What is the association between low-income household assets and asset limits in TANF?
Does the time elapsed since elimination of or increase in the limit have an effect on low-income households’ likelihood to have savings or own a bank account?
What is the association between low-income household bank account ownership and asset limits in TANF?
We created a panel data set that represents wealth and public policy for the odd-numbered years from 2003 through 2013. Data about families were gathered from the Panel Study of Income Dynamics (PSID), a National Science Foundation-funded project that began in 1968 as a random sample of 5,000 families. The PSID survey instrument included a broad-ranging selection of questions summarizing the demographic and economic conditions of respondents. While Nam (2008) compared families at just two time points, 1994 and 2001, in large part because the PSID collected data on wealth at five-year intervals until 1999, we conducted a panel analysis that includes six biennial surveys administered from 2003 to 2013.
We compared assets and bank account ownership of low-income female-headed households to multiple control groups for the years 2003-2013 using a difference-in-difference analytical approach. Our results suggest that wealth is associated with race and income, but not with asset limit policies. Bank account ownership was similarly unaffected by Temporary Assistance to Needy Families (TANF) policy.
Since the 1970s, median income for low-, middle-, and upper-income families has climbed steadily, if unevenly. However, this differential has been significantly outpaced by a disparity in the financial assets of the richest and poorest families. Between 1983 and 2010, families in the highest income quintile increased their wealth approximately 120 percent, while families in the lowest quintile lost wealth, with average assets below zero in 2010. Disparities in household wealth are even starker along racial lines. Median wealth for white families in 2011 was $111,146, compared with just $7,113 for black families and $8,348 for latino families. These disparities in wealth grew dramatically during the Great Recession, especially for poor and minority families. This may explain why the ownership of a bank account and total assets were associated only with income and race in our analysis. However, future research must consider whether there were other factors at play in our findings. While the recession was likely a significant contributor to household wealth during the time period under examination, it would be useful to look further at state-level demographic and economic characteristics among the states that altered their asset limits. Further, since most of the states to eliminate limits did so in the last three years of our analysis, it might be difficult to discover any lagged policy effects.
The lack of association between TANF asset limits and savings behavior is both good and bad news for state lawmakers. While eliminating or increasing the asset limit does not appear to be the silver bullet for encouraging financial independence among low-income families, it is also clear that liberalizing the asset test does not encourage the sheltering of significant assets while remaining eligible for public assistance. These findings, in addition to the lack of effect on state TANF caseloads and the potential administrative savings support the efforts of advocates and lawmakers seeking to better align the TANF program with other assert-development policies such as mortgage-interest deductions, tax-sheltered retirement accounts, and 529 plans.
Since the 1970s, median income for low-, middle-, and upper-income families has climbed steadily, if unevenly. However, this differential has been significantly outpaced by a disparity in the financial assets of the richest and poorest families. Between 1983 and 2010, families in the highest income quintile increased their wealth approximately 120 percent, while families in the lowest quintile lost wealth, with average assets below zero in 2010. Disparities in household wealth are even starker along racial lines. Median wealth for white families in 2011 was $111,146, compared with just $7,113 for black families and $8,348 for latino families. These disparities in wealth grew dramatically during the Great Recession, especially for poor and minority families. This may explain why the ownership of a bank account and total assets were associated only with income and race in our analysis. However, future research must consider whether there were other factors at play in our findings. While the recession was likely a significant contributor to household wealth during the time period under examination, it would be useful to look further at state-level demographic and economic characteristics among the states that altered their asset limits. Further, since most of the states to eliminate limits did so in the last three years of our analysis, it might be difficult to discover any lagged policy effects.
- Get link
- X
- Other Apps
Popular posts from this blog
HudsonUP Year 1 Findings
As year 2 of HudsonUP’s first cohort comes to a close, it is time to look back on our successes. With 25 participants spanning across the small city of Hudson, New York, the pilot proved not only beneficial to its recipients, but influential for further research into the effectiveness of universal basic income (UBI) in struggling communities. HudsonUP provides $500 a month for 5 years to 25 low income residents, unconditionally. A second cohort of 50 participants were added in Fall of 2021. In Hudson’s community, 23% of residents live in poverty. That’s twice the national average. This 5 year pilot is unique since it allows for the analysis of UBI’s long-term effects. Quantitative and qualitative data is collected from participants twice per year. When the pilot began, 29% participants held full time or part time employment. At the close of year 1, 63% of participants were working either full time or part time jobs. This jump in employment ...
HudsonUP Year 2 makes headway in UBI research
The HudsonUP Basic Income (BI) pilot’s second year wrapped up in the Fall of 2022, which includes 75 individuals over two cohorts. Our lab collected data bi-annually through surveys and interviews with willing participants. In Fall 2022 a third cohort of 53 participants was added, bringing the pilot’s total number to 128 participants. HudsonUP’s unique 5-year length allows a deeper look into the effects of BI on individuals over time. The pilot encompasses a diverse set of Hudson, NY residents, and supports approximately 2% of all Hudson residents, nearly 5% of Hudson households, and 9% of residents living in poverty. Quantitative data from the two cohorts shows that employment rates are steadily increasing above baseline, rising 72% in cohort one, and 150% in cohort two. Along with this, participants increased their savings and made steady improvements to their health. Overall, participants experienced positive c...
What is Universal Basic Income?
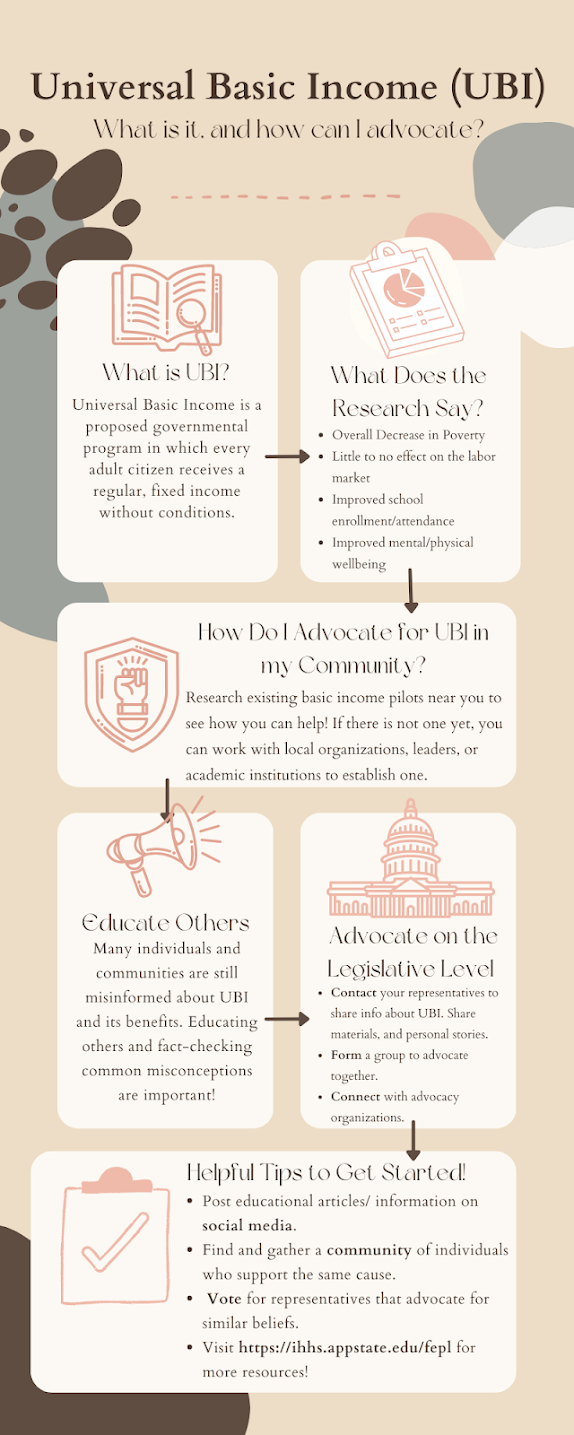
Universal Basic Income (UBI), sometimes referred to as basic income, or guaranteed income, was made popular in current conversation by 2020 Democratic Presidential candidate, Andrew Yang. Providing a guaranteed income for citizens is not a newfound concept, rather, discussions of regular, guaranteed payment to all citizens are found throughout history. The creation of the concept of UBI was fueled by the need to rethink our current welfare state. With heightened levels of inequality, and fear for the future of welfare, research into the effectiveness of UBI is growing each year. Therefore, although the topic of UBI is growing in news and politics, many are still unaware of the basics. There are currently many different models of UBI, and most models include a few common components. These commonalities include, the money being provided to individuals, usually on a month...
Comments
Post a Comment